Your cart is currently empty!

Mastering VCDS Graph: Unlocking Your Car’s Hidden Data
VCDS Graph is a powerful tool that allows you to visualize live data from your car’s control modules. Understanding how to interpret these graphs can be the key to diagnosing complex issues and optimizing your vehicle’s performance. This article will guide you through the essentials of using VCDS Graph, from selecting the right measuring blocks to interpreting the data, and ultimately, fixing the problem.
Understanding the Power of VCDS Graph
VCDS, also known as VAG-COM, is a diagnostic software suite for Volkswagen, Audi, Seat, and Skoda vehicles. Its graphing feature allows technicians and car enthusiasts to monitor multiple data points simultaneously, providing a dynamic view into the inner workings of various systems. Imagine trying to diagnose a sporadic misfire by just looking at static data – difficult, right? VCDS Graph lets you see how different parameters interact in real time, making it much easier to pinpoint the root cause. After the opening paragraph, we’ll explore the key features and benefits of using VCDS Graph. Just like a good vcds clone review can help you choose the right hardware, understanding how to use the software is crucial.
Selecting the Right Measuring Blocks
The foundation of effective VCDS Graph usage lies in choosing the correct measuring blocks. These blocks represent specific data points within your car’s control modules. For example, if you’re diagnosing a boost leak, you might want to monitor boost pressure, MAF readings, and N75 duty cycle. Identifying the relevant measuring blocks requires a good understanding of your car’s systems and the parameters that influence them. Resources like workshop manuals and online forums can be invaluable in this process.
Interpreting the Data: The Key to Diagnostics
Once you’ve selected your measuring blocks, VCDS Graph will display them as lines on a graph. The x-axis typically represents time, while the y-axis represents the value of the parameter being measured. Understanding the normal operating ranges of these parameters is crucial for interpreting the data. Deviations from these ranges can indicate a problem. For example, a fluctuating boost pressure line might suggest a boost leak, while a flat MAF reading could point to a faulty sensor. To delve deeper into interpreting measuring blocks, you can refer to resources like vcds measuring blocks explained.
Common Applications of VCDS Graph
VCDS Graph has a wide range of applications, from diagnosing engine issues to troubleshooting electrical problems. It’s particularly useful for identifying intermittent faults, which can be difficult to track down with traditional diagnostic methods. Here are a few examples:
- Diagnosing Boost Leaks: Monitor boost pressure, MAF readings, and N75 duty cycle simultaneously.
- Troubleshooting Fuel Delivery Problems: Analyze fuel rail pressure, injector duty cycle, and fuel pump operation.
- Investigating Sensor Issues: Compare sensor readings with expected values to identify faulty sensors.
- Optimizing Engine Performance: Analyze timing advance, air/fuel ratio, and other performance parameters.
Advanced VCDS Graph Techniques
For more experienced users, VCDS Graph offers advanced features such as logging data to a file for later analysis and comparing multiple logs to identify trends. These features can be invaluable for diagnosing complex problems that require in-depth analysis. For instance, you can use logging to capture data during a test drive and then analyze it later to pinpoint the cause of a specific issue. Similar to checking the timing with vcds pd timing check, understanding these advanced techniques can help you diagnose complex issues.
Troubleshooting Tips for VCDS Graph
Sometimes, you might encounter issues while using VCDS Graph. Here are a few troubleshooting tips:
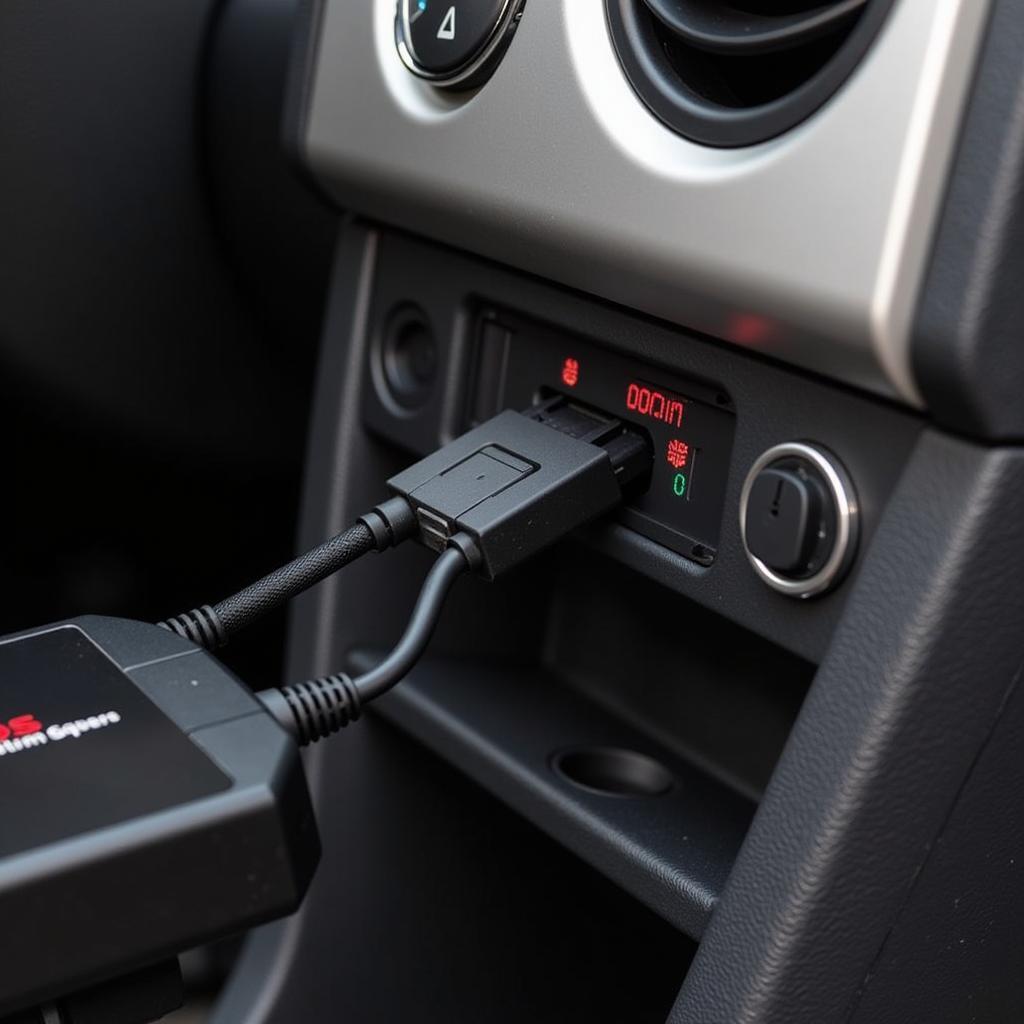
- Ensure proper connection: Make sure the interface is correctly connected to the car and the computer.
- Select the correct control module: Double-check that you have selected the appropriate control module for the system you are diagnosing.
- Update your software: Using the latest version of VCDS ensures compatibility and access to the latest features.
 Troubleshooting VCDS Connection Issues
Beyond VAG Vehicles: Alternatives to VCDS Graph
While VCDS is specifically designed for VAG vehicles, similar diagnostic software and graphing capabilities exist for other car makes. If you’re working on a BMW, for example, you might be interested in learning about the vcds equivalent for bmw.
Conclusion
VCDS Graph is a powerful diagnostic tool that can unlock a wealth of information about your car’s performance. By understanding how to select the right measuring blocks, interpret the data, and utilize advanced features, you can effectively diagnose complex issues and optimize your vehicle’s performance. If you need further assistance or have any questions, feel free to contact us at +1 (641) 206-8880 and our email address: vcdstool@gmail.com or visit our office at 6719 W 70th Ave, Arvada, CO 80003, USA. We at vcdstool are always ready to help you get the most out of your diagnostic tools.
 Contacting vcdstool for VCDS Support
Do you have a question about capturing images within VCDS? Check out our guide on vcds how to transition image.
by
Tags:
Leave a Reply