Your cart is currently empty!

Mastering VCDS TDI Graph: A Comprehensive Guide for Automotive Diagnostics
VCDS TDI Graph is a powerful tool for diagnosing and troubleshooting TDI engines. This guide will delve into the intricacies of using VCDS TDI Graph, providing valuable insights for car owners, repair shop owners, and automotive technicians alike. We’ll explore how this software can help pinpoint issues, optimize performance, and ultimately save you time and money.
Understanding the Power of VCDS TDI Graph
VCDS, or VAG-COM Diagnostic System, is a widely recognized software used for diagnostics and adjustments on Volkswagen, Audi, Seat, and Skoda vehicles. The TDI Graph function within VCDS offers a unique way to visually analyze the performance of TDI (Turbo Diesel Injection) engines. By plotting data points from various sensors, TDI Graph allows you to identify deviations from normal operating parameters, which can be indicative of underlying problems. This visual representation can be invaluable in understanding complex engine behavior.
How to Use VCDS TDI Graph: A Step-by-Step Guide
- Connect the VCDS Interface: Plug the VCDS interface cable into your vehicle’s OBD-II port and connect it to your computer.
- Launch the VCDS Software: Open the VCDS software on your computer. Ensure the software is up-to-date.
- Select the Control Module: Select the engine control module from the list of available modules within VCDS.
- Navigate to Advanced Measurement Values: Within the engine control module, locate and select “Advanced Measurement Values”.
- Choose Measuring Blocks: Select the specific measuring blocks related to the TDI engine parameters you want to analyze. Consult your vehicle’s service manual or online resources for the correct measuring blocks.
- Activate TDI Graph: Once the measuring blocks are selected, click on the “TDI Graph” button to activate the graphing function.
- Interpret the Graph: The resulting graph will display the selected parameters plotted against time. Analyze the graph for any unusual spikes, dips, or deviations from expected values.
 Connecting VCDS Interface to OBD-II Port
Common Uses of VCDS TDI Graph
VCDS TDI Graph proves invaluable for various diagnostic tasks, including:
- Injector Timing Analysis: Assessing the timing of fuel injectors is crucial for optimal performance and fuel efficiency. TDI Graph can reveal issues with injector timing that may not be apparent through other diagnostic methods.
- Boost Pressure Monitoring: Monitoring boost pressure is essential for turbocharged engines. TDI Graph allows you to visualize boost pressure fluctuations and identify potential problems with the turbocharger or related components.
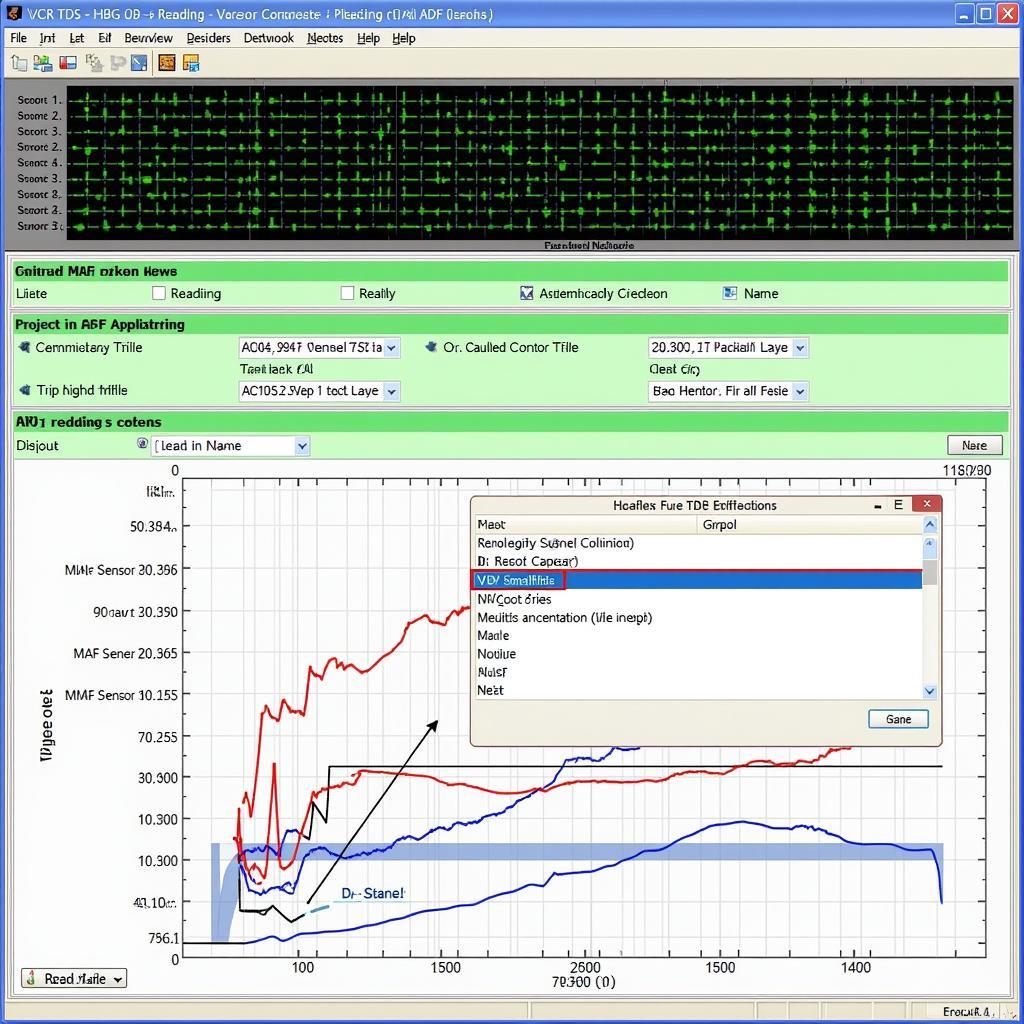
- MAF Sensor Diagnosis: The Mass Air Flow (MAF) sensor plays a critical role in determining the correct air-fuel mixture. TDI Graph helps pinpoint inconsistencies in MAF sensor readings, which can lead to poor performance and fuel economy.
- N75 Valve Functionality: The N75 valve controls boost pressure regulation. Using TDI Graph, you can analyze N75 valve operation and identify any malfunctions that might affect boost control.
Troubleshooting with VCDS TDI Graph: What to Look For
Understanding how to interpret the graphs generated by VCDS is crucial. Look for:
- Sudden Spikes or Dips: These can indicate sensor malfunctions, wiring issues, or mechanical problems.
- Deviations from Expected Values: Compare the graph to known good values or manufacturer specifications to identify deviations.
- Oscillations or Fluctuations: These can point to problems with control systems or sensors.
“Using VCDS TDI Graph allows you to see the story the engine is telling you,” says automotive expert, Dr. Emily Carter, PhD in Mechanical Engineering. “It’s like having a window into the inner workings of your TDI engine.”
VCDS TDI Graph: A Powerful Tool for TDI Enthusiasts and Professionals
VCDS TDI Graph is an invaluable asset for anyone working with TDI engines. Whether you are a seasoned technician or a passionate car owner, understanding how to utilize this tool will greatly enhance your diagnostic capabilities.
“The visual representation provided by TDI Graph simplifies complex data analysis,” adds John Miller, a seasoned automotive technician with over 20 years of experience. “It helps pinpoint issues quickly and efficiently.”
Conclusion
VCDS TDI Graph offers a powerful and intuitive way to diagnose and troubleshoot TDI engines. By understanding how to interpret the data presented in the graphs, you can identify and resolve engine problems more effectively. Contact us at vcdstool for further assistance. Our phone number is +1 (641) 206-8880 and our email address: vcdstool@gmail.com and our office is located at 6719 W 70th Ave, Arvada, CO 80003, USA.
 Diagnosing MAF Sensor Issues with VCDS TDI Graph
FAQ
-
What is VCDS TDI Graph? VCDS TDI Graph is a function within the VCDS software that allows you to graphically visualize data from various TDI engine sensors.
-
How do I access TDI Graph in VCDS? You access TDI Graph through the “Advanced Measurement Values” section within the engine control module in VCDS.
-
What kind of problems can I diagnose with VCDS TDI Graph? You can diagnose a range of issues including injector timing problems, boost leaks, MAF sensor malfunctions, and N75 valve issues.
-
Do I need special training to use VCDS TDI Graph? While specialized training can enhance your understanding, basic knowledge of TDI engines and VCDS software can get you started.
-
Where can I find more information about using VCDS? The official VCDS website and various online forums dedicated to VW/Audi vehicles are great resources.
-
Can I use VCDS TDI Graph on gasoline engines? TDI Graph is specifically designed for TDI (Turbo Diesel Injection) engines.
-
Is VCDS TDI Graph suitable for both professionals and DIYers? Yes, both professionals and DIY enthusiasts can benefit from using VCDS TDI Graph.
by
Tags:
Leave a Reply